


Eric Rahne, B.Sc. in Electrical Engineering, Level 3 Accredited Thermography Expert (PIM Ltd.)
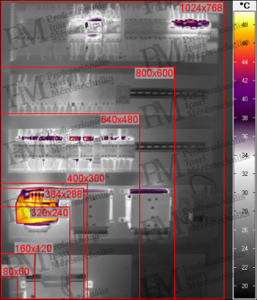
Our series of articles published last month provided insight into some practical issues related to the survey of electrical distribution, switching, and control cabinets, the typical challenges arising from the thermal reflection of electrical equipment surfaces or obstructive plastics, and their solutions, as well as the requirements for geometric resolution to be considered based on the capabilities of the thermal camera. From this current second part, we will learn about the role of thermal camera parameters such as image resolution, image capture/refresh rate, focusing, and depth of field. It is generally a dilemma to determine the pixel resolution (number of pixels) of a thermal camera. Many-pixel (truly) professional thermal cameras, with a large field of view, also have sufficiently good geometric resolution, allowing larger switchgear cabinets to be surveyed and documented with few images. Machine connections or workshop distribution cabinets can typically be captured in a single thermal image. However, thermal cameras with higher pixel counts (larger detectors) also come with significantly higher investment costs. What thermal camera procurement meets the measurement needs while also being cost-effective? Several aspects need to be considered to answer this question: 1. how often (perhaps repeatedly) are the measurements performed, 2. how many and what sizes of switchgear cabinets do we have, and what is the smallest component or cable to be observed within them, 3. what and how should we document? Based on our answers to these questions, we can roughly estimate how many on-site images are needed and then how many thermal images need to be evaluated. In case of special documentation requirements, beyond simple note-taking, the montage of thermal images (which consumes a lot of time) may also become necessary. With a thermal camera of 1024x768 pixels (from an appropriate distance), a single image can survey a switchgear cabinet of up to 0.5x0.7 m in size, containing cables with diameters exceeding 2 mm. Using this as a reference, the labor requirements can be estimated as shown in Table 1.
| thermal camera detector pixel size | 1024 x 768 | 800 x 600 | 640 x 480 | 400 x 300 | 384 x 288 | 320 x 240 | 160 x 120 | 80 x 60 |
| on-site data recording time requirement |
1x |
2x |
3x |
8x |
9x |
13x |
54x |
225x |
| reporting time (without montage) |
1x |
2x |
3x |
8x |
9x |
13x |
54x |
225x |
| thermal image montage time requirement |
none |
1x |
2x |
3x |
5x |
6x |
12x |
96x |
| device cost (compared to reference) |
1x |
0.8x |
0.7x |
0.5x |
0.4x |
0.3x |
0.1x |
<0.1x |
Table 1: Relationship between thermal image pixel count and labor requirement The selection of the appropriate thermal camera can be based on the following logic: choose the thermal camera whose price, ideally with the highest possible pixel count, is lower than the product of the work volume to be done (quantity of cabinets · measurement frequency · the above time multiplier) and the corresponding 3* annual labor cost. (3 years represents half of the current technical obsolescence period of thermal cameras. This is not equal to the typical lifespan of the devices.) Opting for significantly more expensive ones would be wasteful, while the "cheaper" ones would result in excessive labor costs. The thermal camera selected based on the above reasoning will generate clear profit from the third year onwards compared to its lower pixel count competitors.
The image capture/refresh rate is also a technical parameter that cannot be overlooked. Common microbolometer thermal cameras cover a wide range of image capture frequencies. A distinction is generally made between slow 9 ... 15 Hz, and faster 50 ... 60 Hz, and max. 240 Hz refresh rate thermal cameras. (There are even faster thermal cameras providing image capture frequencies up to 9 kHz, which, however, have photon detectors to achieve this speed.) With few exceptions, thermal processes usually have a large time constant, and if the object is stationary, the above (achievable with a bolometer) image frequencies are more than sufficient. However, very fast (transient) thermal processes or rapidly moving measurement objects may require significantly higher image frequencies for recording. For instance, recording the heating process during the activation of an electrical device or the temperature variations during the disconnection of a section under load may necessitate image refresh rates in the kHz range. Serious issues may arise if detailed thermal images or even long-distance measurements are to be taken with a handheld thermal camera. It is a known fact in photography that a steady-handed photographer can capture motionless images even at a 1/60 shutter speed (without a tripod). An "amateur" with an unsteady hand may occasionally result in blurred images even at a 1/125 shutter speed. These shutter speeds represent 17 ms and 8 ms exposure times. What skill is required to capture motionless thermal images with just a 9 Hz thermal camera handheld! This may require up to 30 ...
We should keep the thermal camera still for 40 ms! In other words, to safely capture motion-free thermal images while handheld, the thermal cameras must have an integration time shorter than 15 ms, meaning a refresh rate of 50 Hz or faster.
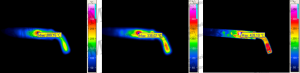
Unfortunately, among the measurement challenges, not only the responsibility of the thermal camera operator to avoid reflections needs to be mentioned, but - since thermal cameras are optical measuring instruments - correct focusing also deserves special attention. Contrary to common belief, failure in focusing leads not only to blurry thermal images but also to serious measurement errors. The depth of field is related to focusing, primarily in the case of close-up shots, where it is very small, imposing significant limitations (and thus serious measurement errors). Optical focusing works the same way as in photography: the task of the collector or focusing lens inside the camera is to project the incoming rays onto the sensor surface (in traditional photography, onto the film). Incorrect focusing results in only a portion of the radiation hitting the "sharp" sensor surface defined by the focus, with the rest being projected around it. This leads to the measured temperature being lower at local maximum and higher at local minimum than in reality. The worse the focus setting, the greater the deviation from the actual value.

Figure 5 shows that with poor focusing, only a part of the incoming radiation hits the correct imaging surface of the sensor matrix, with the rest hitting its surroundings. Therefore, with incorrect focus settings, thermal cameras always show less extreme minimum/maximum temperatures than those on the object's surface in reality, as demonstrated in images 2-4.
The extent of the error (increase in local minimum value and decrease in local maximum value) depends on the depth of field related to the measurement distance and the geometrical size of the local minimum/maximum. The closer the measurement is taken (thus with a smaller depth of field), the more critical precise focusing becomes. With an increase in the geometrical size (extent) of the local minimum or maximum, the magnitude of value distortion decreases. Details are shown in Table 2.
| Displayed peak temperature [°C] | ||||
| Size of 100°C hot spot | 19x19 pixels | 15x15 pixels | 9x9 pixels | 3x3 pixels |
| Correct focus |
100 |
100 |
100 |
100 |
| 1 pixel defocus |
99 |
98 |
97 |
93 |
| 2 pixels defocus |
98 |
97 |
95 |
88 |
| 3 pixels defocus |
96 |
96 |
93 |
84 |
| 5 pixels defocus |
94 |
93 |
90 |
78 |
| 10 pixels defocus |
90 |
88 |
83 |
69 |
| 20 pixels defocus |
84 |
81 |
75 |
60 |
Table 2: Displayed peak temperatures based on hot spot size and focus accuracy (hot spot at 100°C, and 20°C on other object surfaces)
The object's imaging should not only be sharp from the object plane defined precisely by the thermal camera's optical system and focused "sharply," but also for objects closer and farther away from the set distance, within the so-called depth of field range. The depth of field range depends on the following parameters:
Consequently, especially in very close-up shots (e.g., with macro lenses or microscope objectives) and due to the large aperture size used in low measurement ranges, the depth of field range is very small. Therefore, this problem is mainly characteristic of microbolometer thermal cameras with significantly lower sensitivity compared to photon detectors, especially at short object distances. When focusing at a distance corresponding to the n-th part of the hyperfocal distance, the depth of field range decreases approximately with an n² value. To illustrate the boundaries of the depth of field, consider a thermal camera with the following parameters: detector pixel size (rp): 17 µm (diagonal), lens: aperture number (k): 1, and focal length (f): 30 mm. From these data (aperture number and focal length), it immediately follows that the lens aperture size is 30 mm. From this, we can calculate the hyperfocal distance (i.e., the distance at which the depth of field range extends to infinity). Using the approximate equation l hf = f x d irisz /r p, in this example, it is 5.3 m. At this point, the near limit of the depth of field is exactly half the focal length, i.e., 2.65 m.
To calculate the near and far limits of depth of field without equations, their values are graphically represented in Figure 6. Depending on the selected focal length, a sharp thermal image is obtained within the indicated boundaries here - with a distant focus, over a wide distance range, but with a close focus, only within a very narrow range.
(To be continued!) Eric Rahne (PIM Ltd.) pim-kft.hu, termokamera.hu
The content of the publication is protected by copyright, and its (even partial) use, electronic or printed re-publication is only permitted with the indication of the source and author's name, as well as with the author's prior written consent. Violation of copyright (Copyright) entails legal consequences.
Copyright © PIM Professzionális Ipari Méréstechnika Kft.
2026 | Minden jog fenntartva
Impresszum | Adatkezelés